Before all nations come together in Paris to seal a new deal on climate change, two questions remain: are countries’ emissions reduction targets fair, and are they sufficiently ambitious?
Today we have released a new interactive website that allows you to calculate the answers to those questions, based on a new paper published in Nature Climate Change.
Country pledges
Commitments put forward by nations are known as Intended Nationally Determined Contributions, or INDCs. To date, 154 countries, collectively responsible for 88% of global greenhouse gas emissions, have submitted pledges to the international climate change body, the United Nations Framework Convention on Climate Change.
Unfortunately, each pledge has been framed using different measures.
Most developed nations have announced total emissions reductions by a particular end year compared to a base year. For instance Australia has pledged to reduce total emissions by 26-28% by 2030 compared to 2005. However, the end year and base year are different for almost every country.
Some developing countries, such as China and India, have announced their targets as reductions in emissions intensity (emissions per unit of GDP), in combination with other targets such as renewable energy.
Some other developing countries, such as Mexico, Argentina and Indonesia, have presented their emissions reduction targets as compared to projected business-as-usual (what emissions would be without reduction efforts).
Comparing the pledges
How do we compare all these pledges to determine whether they are fair and ambitious? The first step is to convert them all into the same metrics. We’ve done this on our INDC Factsheets webpage.

This allows us to better compare countries climate pledges. For instance, if we look at emissions per person, we can see that Australia’s pledge is equal to a reduction of 38% below 2010 levels by 2030 and the United States' pledge is equal to a 39% reduction for the same period.
However Australia’s per person emissions are among the highest in the world and will still be 50% higher than China’s and double those of the EU in 2030.
Are we on track for 2⁰C?
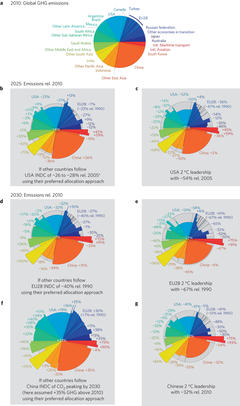
Global greenhouse gas emissions in 2010 totalled 48 billion tonnes. For a likely chance of staying within the internationally agreed limit of 2⁰C global warming, we need to reduce global emissions to 41 billion tonnes by 2025 and return them to 1990 levels (or 37 billion tonnes) by 2030, on a long-term trajectory to zero emissions.
Our new website shows how the G20 countries can contribute to this challenge.
The first step is to choose a country, and then an emissions reduction target. The defaults are the pledges countries have submitted ahead of the Paris meeting, but you can choose your own emissions reductions.
The next step is to choose how to distribute emissions reductions between countries. There are six possibilities:
Per-capita: this approach assumes that all countries will have equal per-person emissions by 2050
Equal cumulative per person 1950 or 1990: this approach assumes that all countries have equal past and future emissions per person averaged from 1950 or 1990. This effectively corrects for countries that had high emissions in the past
Leader: this approach (explained here) matches each other country’s pledge to the first country’s, using each time one of the above two options (arguably this is the fairest way for countries to choose their pledges)
Greenhouse Development Rights: this approach from the Stockholm Environment Institute uses an index based on a country’s income and historical emissions.
Leader and Greenhouse Development Rights: this approach matches other countries' pledges to the first country’s. This allows countries to choose their lowest reduction from the other approaches.
From this we can see that if Australia chooses a reduction of 26% on 2005 levels by 2030, and every other country follows suit using a per capita approach, total global emissions are 1 billion tonne above what would be needed to stay within 2⁰C of warming

Where the pie wedges are smaller than the grey area, the emissions of that country are less than they were in 2010. Where the wedge is larger, covering the grey area, the emissions are more than they were in 2010.
However if we choose the leader approach (where countries follow Australia’s “leadership” but choose whether to do it using a per-capita or equal cumulative per capita approach) we can see that global emissions are 12 billion tonnes too high in 2030.

You can also get a more detailed breakdown of what each country’s pledge would be under each scenario. For instance the table below shows each country’s pledge under a per-capita scenario based on Australia’s pledge of 26% below 2005 levels by 2030.
Follow the leader
Total emissions targets if countries were to match Australia's post-2020 climate pledge.
| Country | Reduction below 2010 |
|---|---|
| Argentina | 7% |
| Australia | -28% |
| Austria | -10% |
| Belgium | -23% |
| Brazil | -15% |
| Bulgaria | -21% |
| Canada | -34% |
| China | 22% |
| Croatia | -27% |
| Cyprus | 8% |
| Czech Republic | -39% |
| Denmark | -24% |
| Estonia | -52% |
| European Union (28) | -16% |
| Finland | -30% |
| France | -7% |
| Germany | -34% |
| Greece | -7% |
| Hungary | -19% |
| India | 105% |
| Indonesia | -12% |
| Intl. aviation | 91% |
| Intl. maritime transport | 75% |
| Ireland | -18% |
| Italy | -3% |
| Japan | -19% |
| Latvia | -108% |
| Lithuania | -54% |
| Luxembourg | -24% |
| Malta | 5% |
| Mexico | 24% |
| Netherlands | -21% |
| Norway | 25% |
| Poland | -31% |
| Portugal | 31% |
| Rest of East Asia | -45% |
| Rest of Economies in Transition | 5% |
| Rest of Latin America | 4% |
| Rest of Middle East & North Africa | 32% |
| Rest of Pacific Asia | -14% |
| Rest of Pacific OECD | -25% |
| Rest of South Asia | -45% |
| Rest of Sub-Saharan Africa | -11% |
| Rest of Western Europe | -33% |
| Romania | 0% |
| Russian Federation | -41% |
| Saudi Arabia | -4% |
| Slovakia | -18% |
| Slovenia | -10% |
| South Africa | -9% |
| South Korea | -24% |
| Spain | 24% |
| Sweden | 79% |
| Switzerland | 10% |
| Turkey | 16% |
| United Kingdom | -19% |
| United States of America | -38% |
| World total | 2% |
The tools will provide negotiators and observers with all that is needed to crunch the numbers on a fair and ambitious agreement. We still need bigger reductions in emissions to avoid dangerous climate change. Play around and see what it takes to create a world that limits warming to 2⁰C.