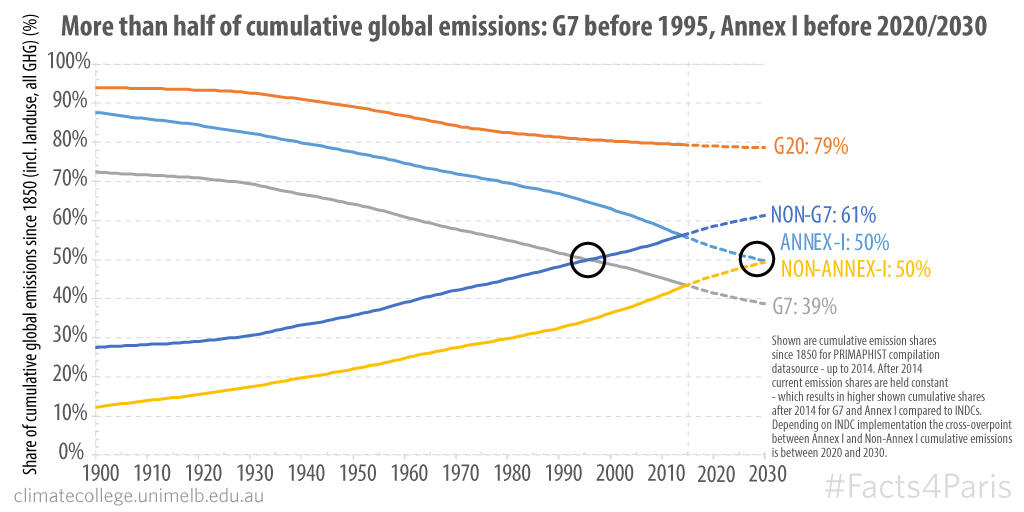
Facts4Paris: Until 1995, the G7 were the major cumulative emissions contributor but not after; and sometime in 2020-30 non-Annex I nations become the major cumulative contributors.

The industrialised countries were responsible for the majority of emissions during much of the 20th century, despite having only a small fraction of the world's population. In fact, up to 1995, more than half of all global cumulative emissions were produced by the G7 countries.
After 1995, the majority of emissions has been caused by non-G7 countries (see the crossover point on the graph above).
For Annex I countries (the UNFCCC grouping of developed countries that includes Russia) the picture is similar. Annex I countries have been the majority emitting group, but they are on a downward trajectory and will crossover with non-Annex I countries. When that happens, more than 50% of cumulative historical emissions will have been produced by non-Annex I countries. When exactly that crossover might happen is unknown. Datasources vary and future projections are, of course, uncertain. If we simply assume constant emissions after 2014, the crossover point is 2030. If, on the other hand, we assume the INDC scenarios (in which Annex I emissions continue to fall) the crossover point is likely to be somewhere between 2020 and 2030.
If we relate climate impacts are directly to cumulative emissions, then until 1995 G7 countries were the majority cause of climate impacts and since 1995, non-G7 countries have been the majority cause of climate impacts. Similarly, until sometime in 2020-2030, Annex I countries are more than 50% responsible for climate impacts.