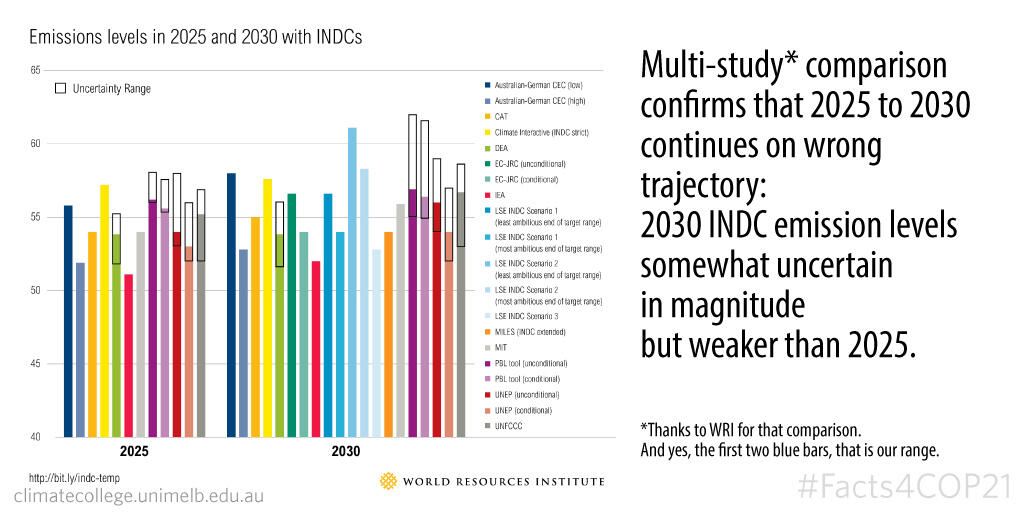
Facts4COP21: Multi-study comparison confirms that global emissions heading in the wrong direction from 2025 to 2030.

The World Resources Institute has collated and compared all the main global studies that quantify INDCs.
Although there is a fair spread across the individual studies—many providing INDC ranges with low and high values, as well as conditional and unconditional quantifications— there is one trend that is clear across the board. If INDCs are implemented as they are currently stand, emission levels in 2030 are not likely to be below emission levels in 2025. Unfortunately though, emissions trajectories consistent with a least-cost implementation of the 2°C target head downwards between 2025 and 2030; they do not remain constant nor do they increase.
Oh, and on the graph, the first two dark blue bars (labelled: "Australian-German CEC") are our own calculations based on our INDC factsheets (30th October version) available here.